This widget displays the scale of the y axis (formatted text values) for a graph corresponding to the associated curve. It is typically used in a table under a graph grid for one or several CURVE_GRAPH objects.
See attributes common to all curve widgets.
See also the PARAM_TEXT specific attributes, since this widget displays text formatted from parameter information.
This widget is deprecated and has been supersed by the RULER widget
| Name | Value Type | Default Value | Description | Comment | V. |
|---|---|---|---|---|---|
|
color |
current text color |
Color of the displayed text. |
|
1.1 |
|
|
text_v_align |
center |
Vertical alignment of the text. |
This alignment is relative to a regularly spaced grid. See the examples for more details. |
1.1 |
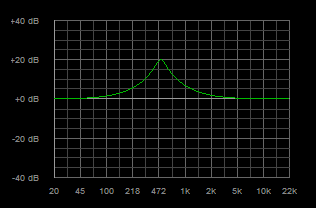
<?xml version="1.0" encoding="utf-8" ?>
<SKIN language_version="1.0" background_color="#000000" v_margin="10" h_margin="10">
   <!--Table layout for the graph. Custom font used for all the widgets-->
   <TABLE width="300" height="200" h_margin="3" v_margin="3" font_face="arial" font_quality="cleartype"
      font_height="11" font_width="5" font_weight="normal">
      <TABLE_ROW height="90%">
         <!-- Y scale-->
         <CURVE_YSCALE text_h_align="right" text_v_align="center" h_align="right" v_margin="8" height="100%"
            width="10%" curve_id="dsp.output_curve1" color="#888888" value_format="+.0" content="{value} {unit}"
            y_positions_count="5" />
         <!-- Layer stack cell to stack the grid and curve -->
         <LAYER_STACK height="100%" width="90%" v_margin="8" h_margin="14">
            <CURVE_GRID x_subdiv_count="1" y_subdiv_count="3" width="100%" height="100%" subdiv_color="#444444"
               color="#666666" origin_color="#999999" curve_id="dsp.output_curve1" x_positions_count="10"
               y_positions_count="5" />
            <CURVE_GRAPH width="100%" height="100%" color="#00bb00" x_response_curve="exp3"
               curve_id="dsp.output_curve1" />
         </LAYER_STACK>
      </TABLE_ROW>
      <TABLE_ROW height="10%">
         <CELL />
         <CURVE_XSCALE text_h_align="center" h_align="right" h_margin="14" height="100%" width="90%" value_suffix="true"
            curve_id="dsp.output_curve1" color="#888888" value_format=".0" content="{value}" x_positions_count="10"
            x_response_curve="exp3" />
      </TABLE_ROW>
   </TABLE>
</SKIN>